
Augmented reality has great potential to present multi-dimensional data in an immersive way. This page demonstrates experiments with different visualization types and technologies to turn 2d graphics into AR-supported 3d models.
In the first experiment, we explored the three most common types of data visualizations; scatter plot, network graph, and treemap, and analyzed the ways in which the AR can enhance the capabilities of visualizations.
Besides visualizing multi-dimensional data, AR can also change the way how we interact with printed graphics. Currently, one of the biggest challenges with printed data visualization is that readers cannot interact with the graphs.
In the second experiment, we explored Google’s model-viewer web component to render data visualization models on the web. This library also allows users to view 3d models through Augmented Reality on supported devices.
Visualization stack: 3D.js & Three.js
AR stack: Unity 3D, Vuforia for image targeting, Model Viewer
Scatter Plot
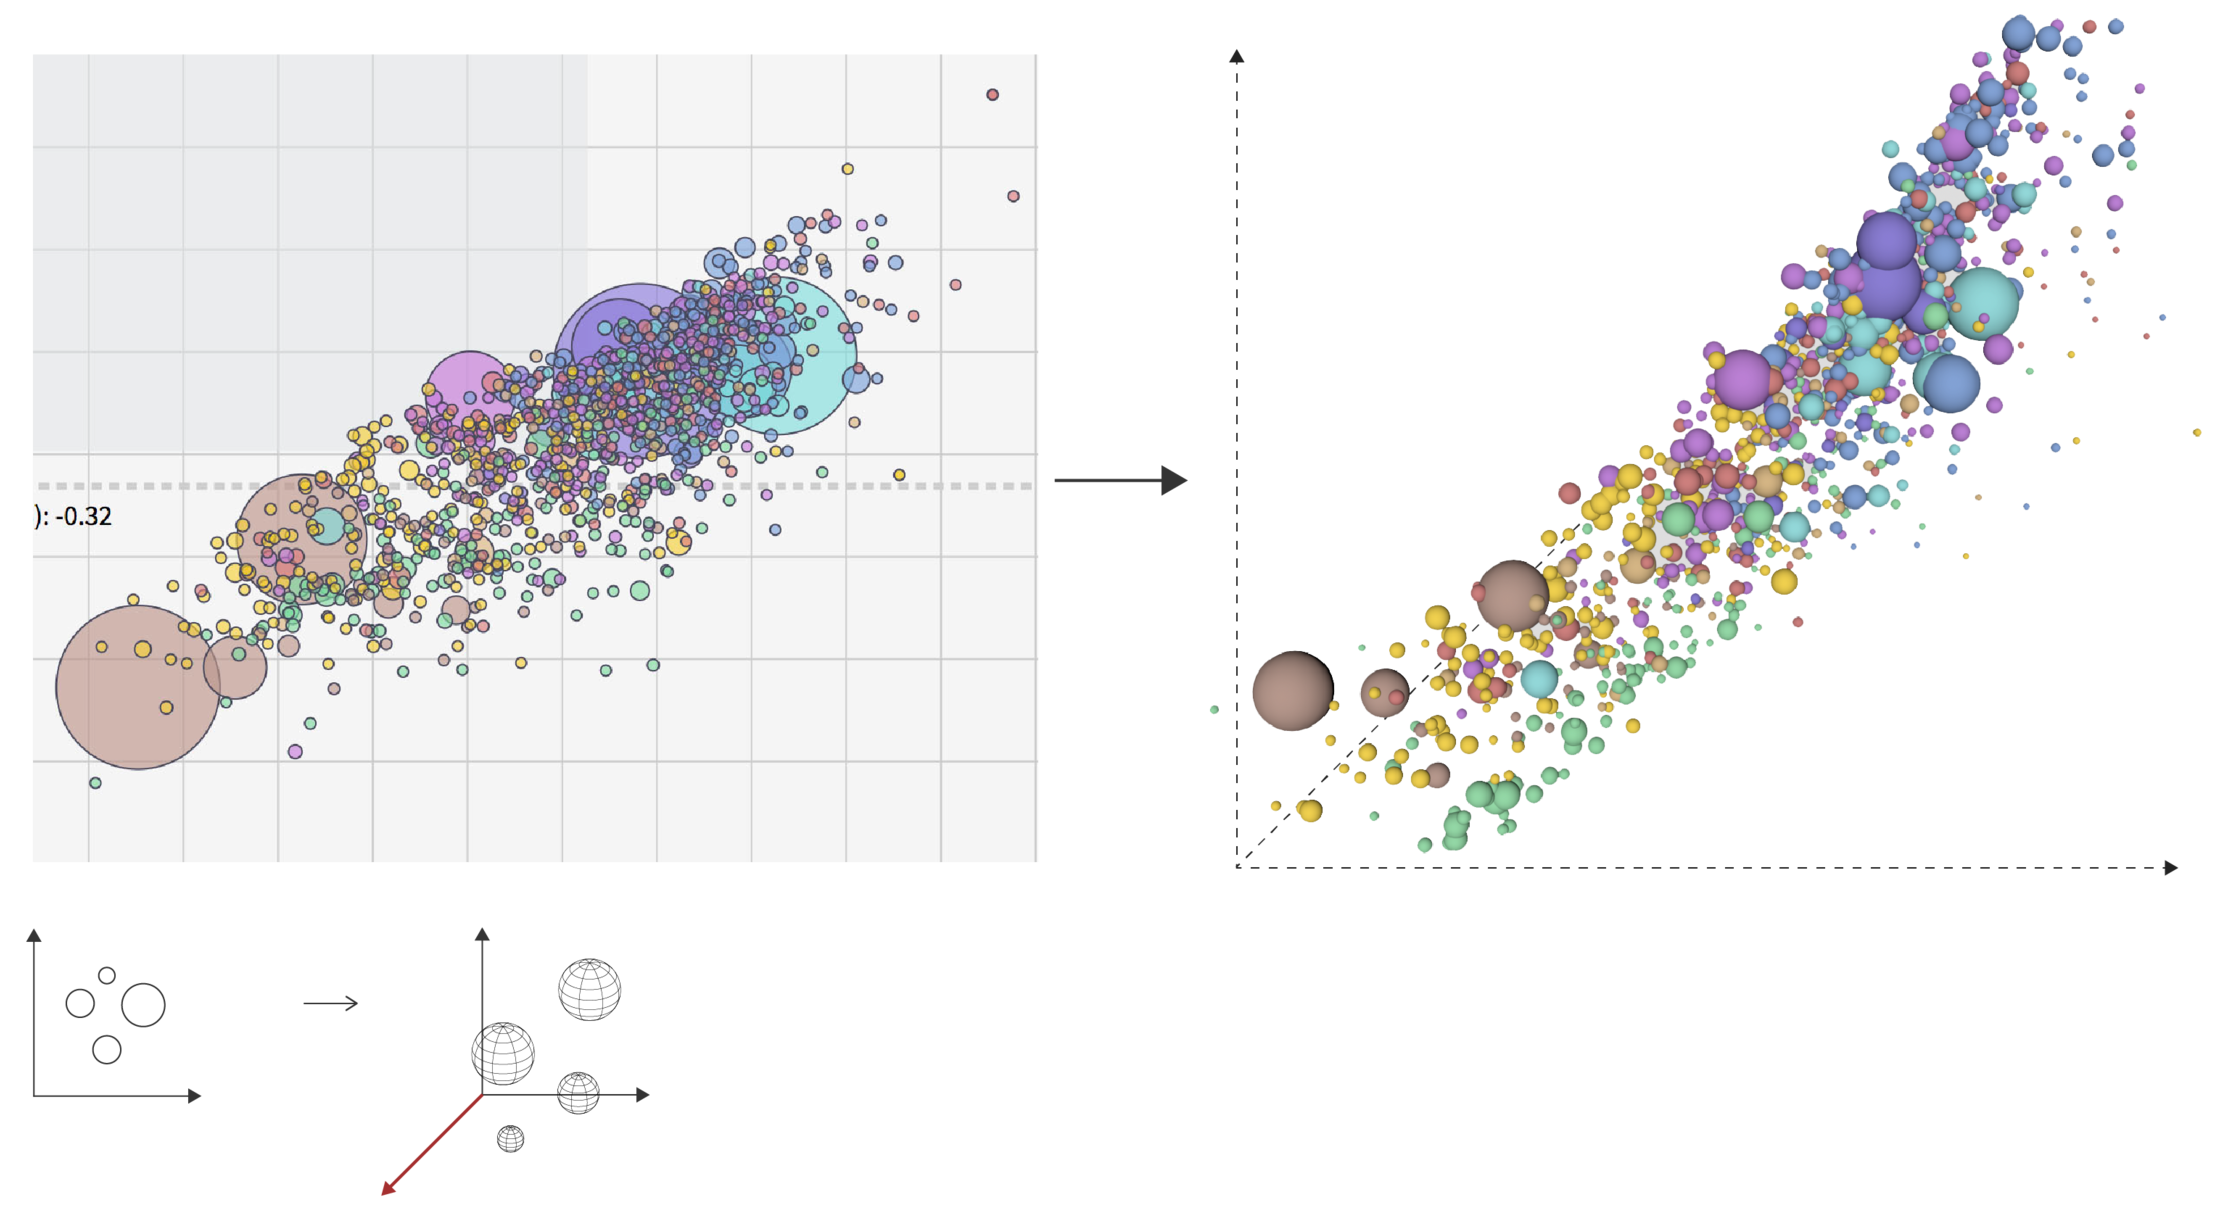
The model is AR-supported, you can use your mobile device
NETWORK VISUALIZATION
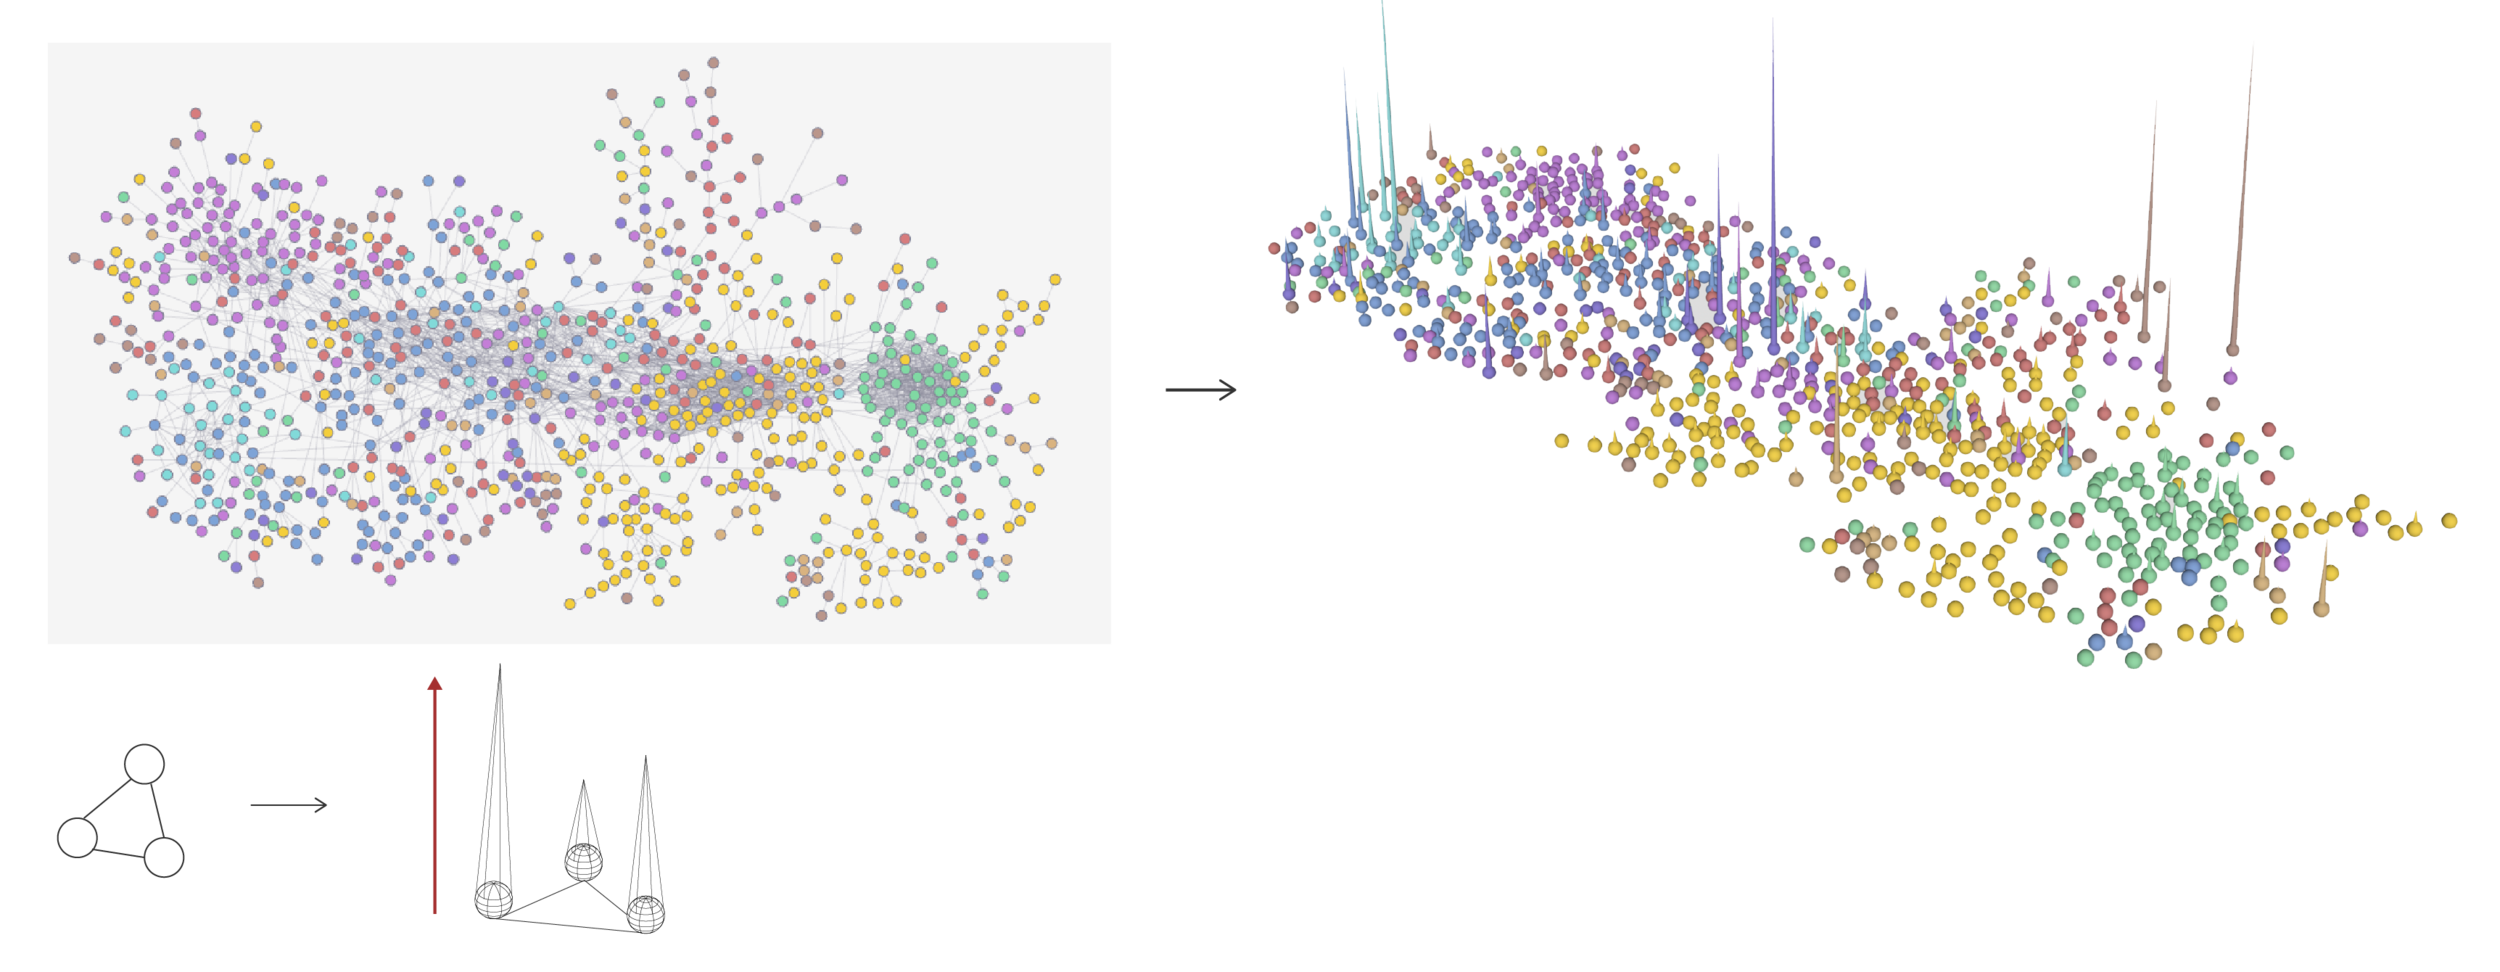
The model is AR-supported, you can use your mobile device
TREE MAPS
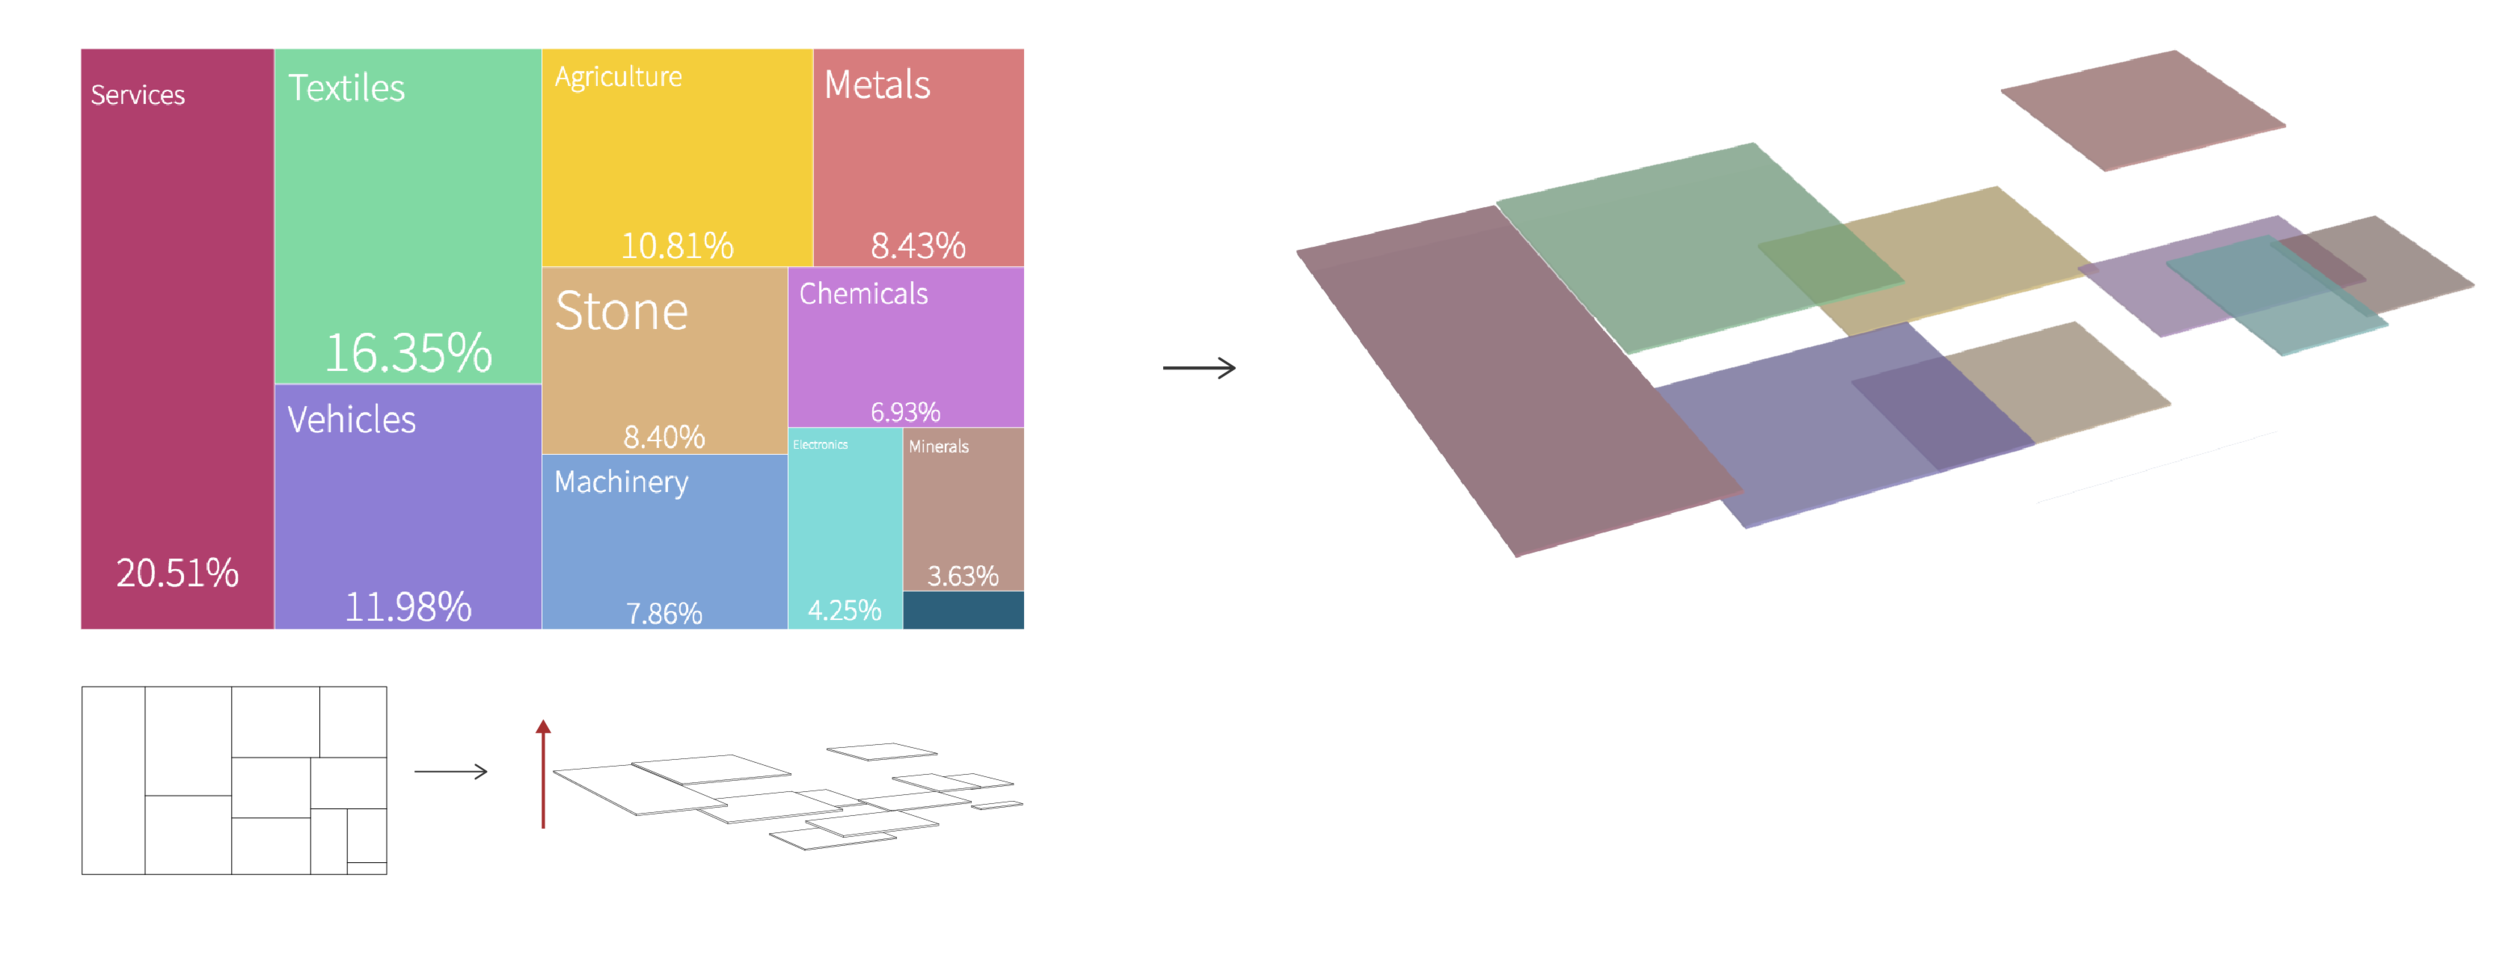
The model is AR-supported, you can use your mobile device
These experiments are created by Nil Tuzcu mostly for learning AR/XR world and exploring their implication in information design. This is an ongoing project, so you'll probably see more experiments if you come back!
Data and 2d visualizations are borrowed from Atlas of Economic Complexity.